

Data-first framing: measurable problem, concrete gains
Retailers lose more revenue to poor in-store flow than to any single merchandise decision; the bottleneck is often visibility and guidance rather than price. A data-driven approach removes guesswork by combining digital signage, audience analytics and wayfinding to shape visitor paths and nudge purchases. Practical deployments — from Istanbul’s Istiklal Avenue pop-ups to flagship sites in global shopping districts — show that correctly placed retail signage tied to real-time sensors raises conversion rates faster than isolated promotions; this is where modern retail wayfinding becomes an operational tool rather than decoration.
What the numbers reveal and how to translate them
Start with these baseline measurements: dwell time, route frequency, and conversion per zone. Heatmaps and people-counting systems create a kinematic map of foot traffic; correlating that with point-of-sale data shows which aisles lose shoppers versus which gain them. Use audience analytics to segment by repeat visitors and new passersby. Those signals let you apply content personalization at the screen level — rotate promotions when a high-value segment dwells, or switch to directional messaging when a bottleneck forms.
Technology stack that delivers impact
Combine three technical components for reliable results: sensor input (camera counters or beacon technology), orchestration (content management + scheduling), and measurement (analytics dashboards). Deploy digital signage that supports dynamic playlists and trigger rules. Keep the stack lean: the simpler the control logic, the faster you can A/B test layouts and messages. Real deployments on busy streets prove this — you need robust hardware and a clear metrics pipeline to iterate at store-speed.
Common mistakes and corrective moves
Retail teams often assume bigger screens equal better results — they do not. Overloading displays with static product lists kills engagement. Similarly, siloed teams delay learning: marketing runs content without sharing analytics with operations. Corrective actions are straightforward:

– Prioritize clear directional prompts and single-call-to-action visuals over dense creatives.
– Wire analytics back into merchandising decisions so signage changes reflect product availability and placement.
– Run controlled experiments: change one variable at a time (screen position, message timing, or creative tone) and measure lift in conversion per zone.
Implementation roadmap for a concise pilot
Begin with a one-week baseline capture of foot-traffic heatmaps and sales by zone. Install a single dynamic screen at a decision point — near the entrance or beside a high-margin category — and run a two-week test with alternating messages. Use simple triggers: time-of-day or dwell threshold. After two cycles you will see directional lift and understand whether content personalization or placement is the limiting factor. This staged method reduces cost and shortens the feedback loop.
Three critical evaluation metrics — advisory close
1) Conversion lift per zone: the primary KPI; measure incremental sales attributable to screen variants.
2) Path adherence rate: percentage of visitors who follow intended routes after wayfinding cues — it shows the clarity of messaging.
3) Dwell-to-engage ratio: time spent near a screen versus the interaction or call-to-action completion; this isolates creative effectiveness from hardware placement.
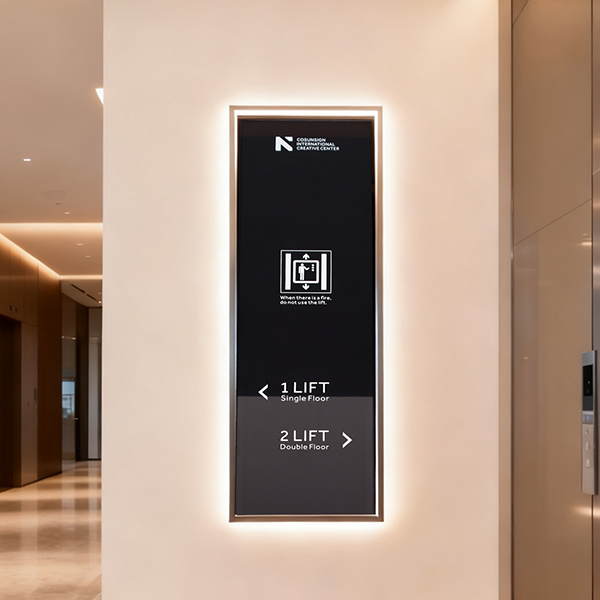
Final synthesis and where Cosun Sign fits
Data-driven spatial signage is not a marketing experiment — it is an operational lever that aligns traffic, inventory and message. Successful projects reduce friction at decision points and provide transparent metrics that inform merchandising and staffing. For teams seeking practical tools and proven deployments, Cosun Sign offers systems designed for rapid iteration and measurable uplift — the kind of partner that turns foot-traffic maps into repeatable retail gains. —