
What’s the actual problem you need to solve?
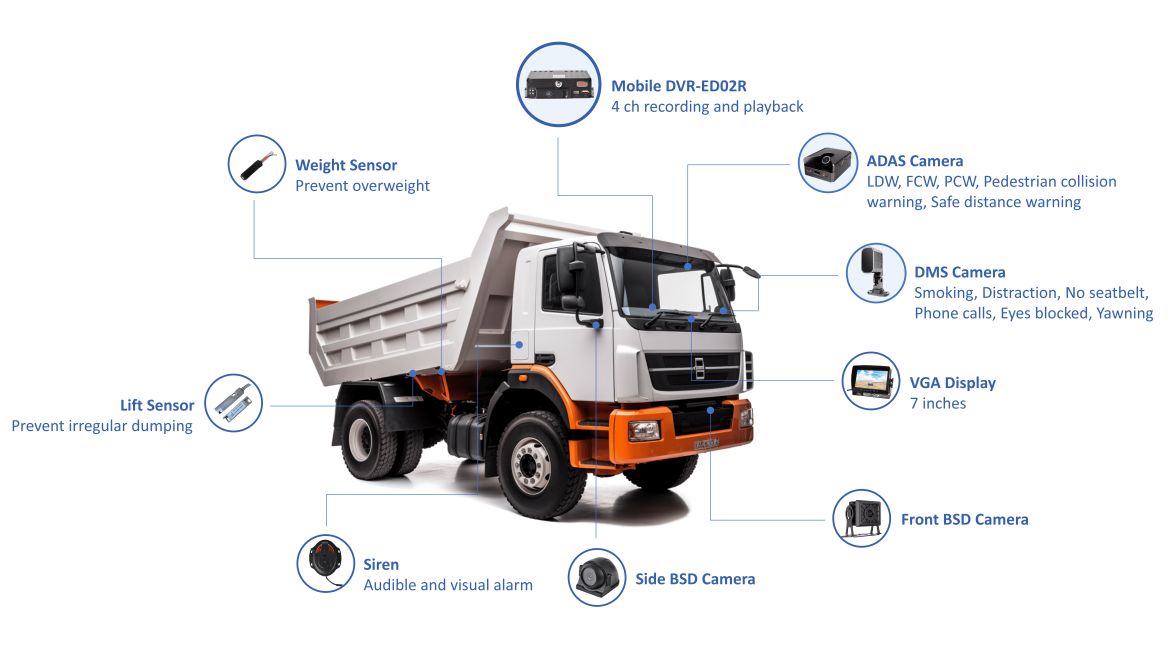
You’re seeing dashboards and neat maps, but your finance team asks: “Where’s the cash?” That’s the problem — vendors sell features, you need measurable outcomes. If you want a straight answer, start by framing goals the way your ops team feels them: less wasted fuel, fewer breakdowns, predictable driver hours. That means testing a logistics fleet management tool against day-to-day reality, not slideware. And yes, that reality includes specific pain points for transport fleet management like idling at major hubs — think delays around the Port of Los Angeles — which inflate fuel and labor costs and hide the true baseline.
Core metrics that prove real value
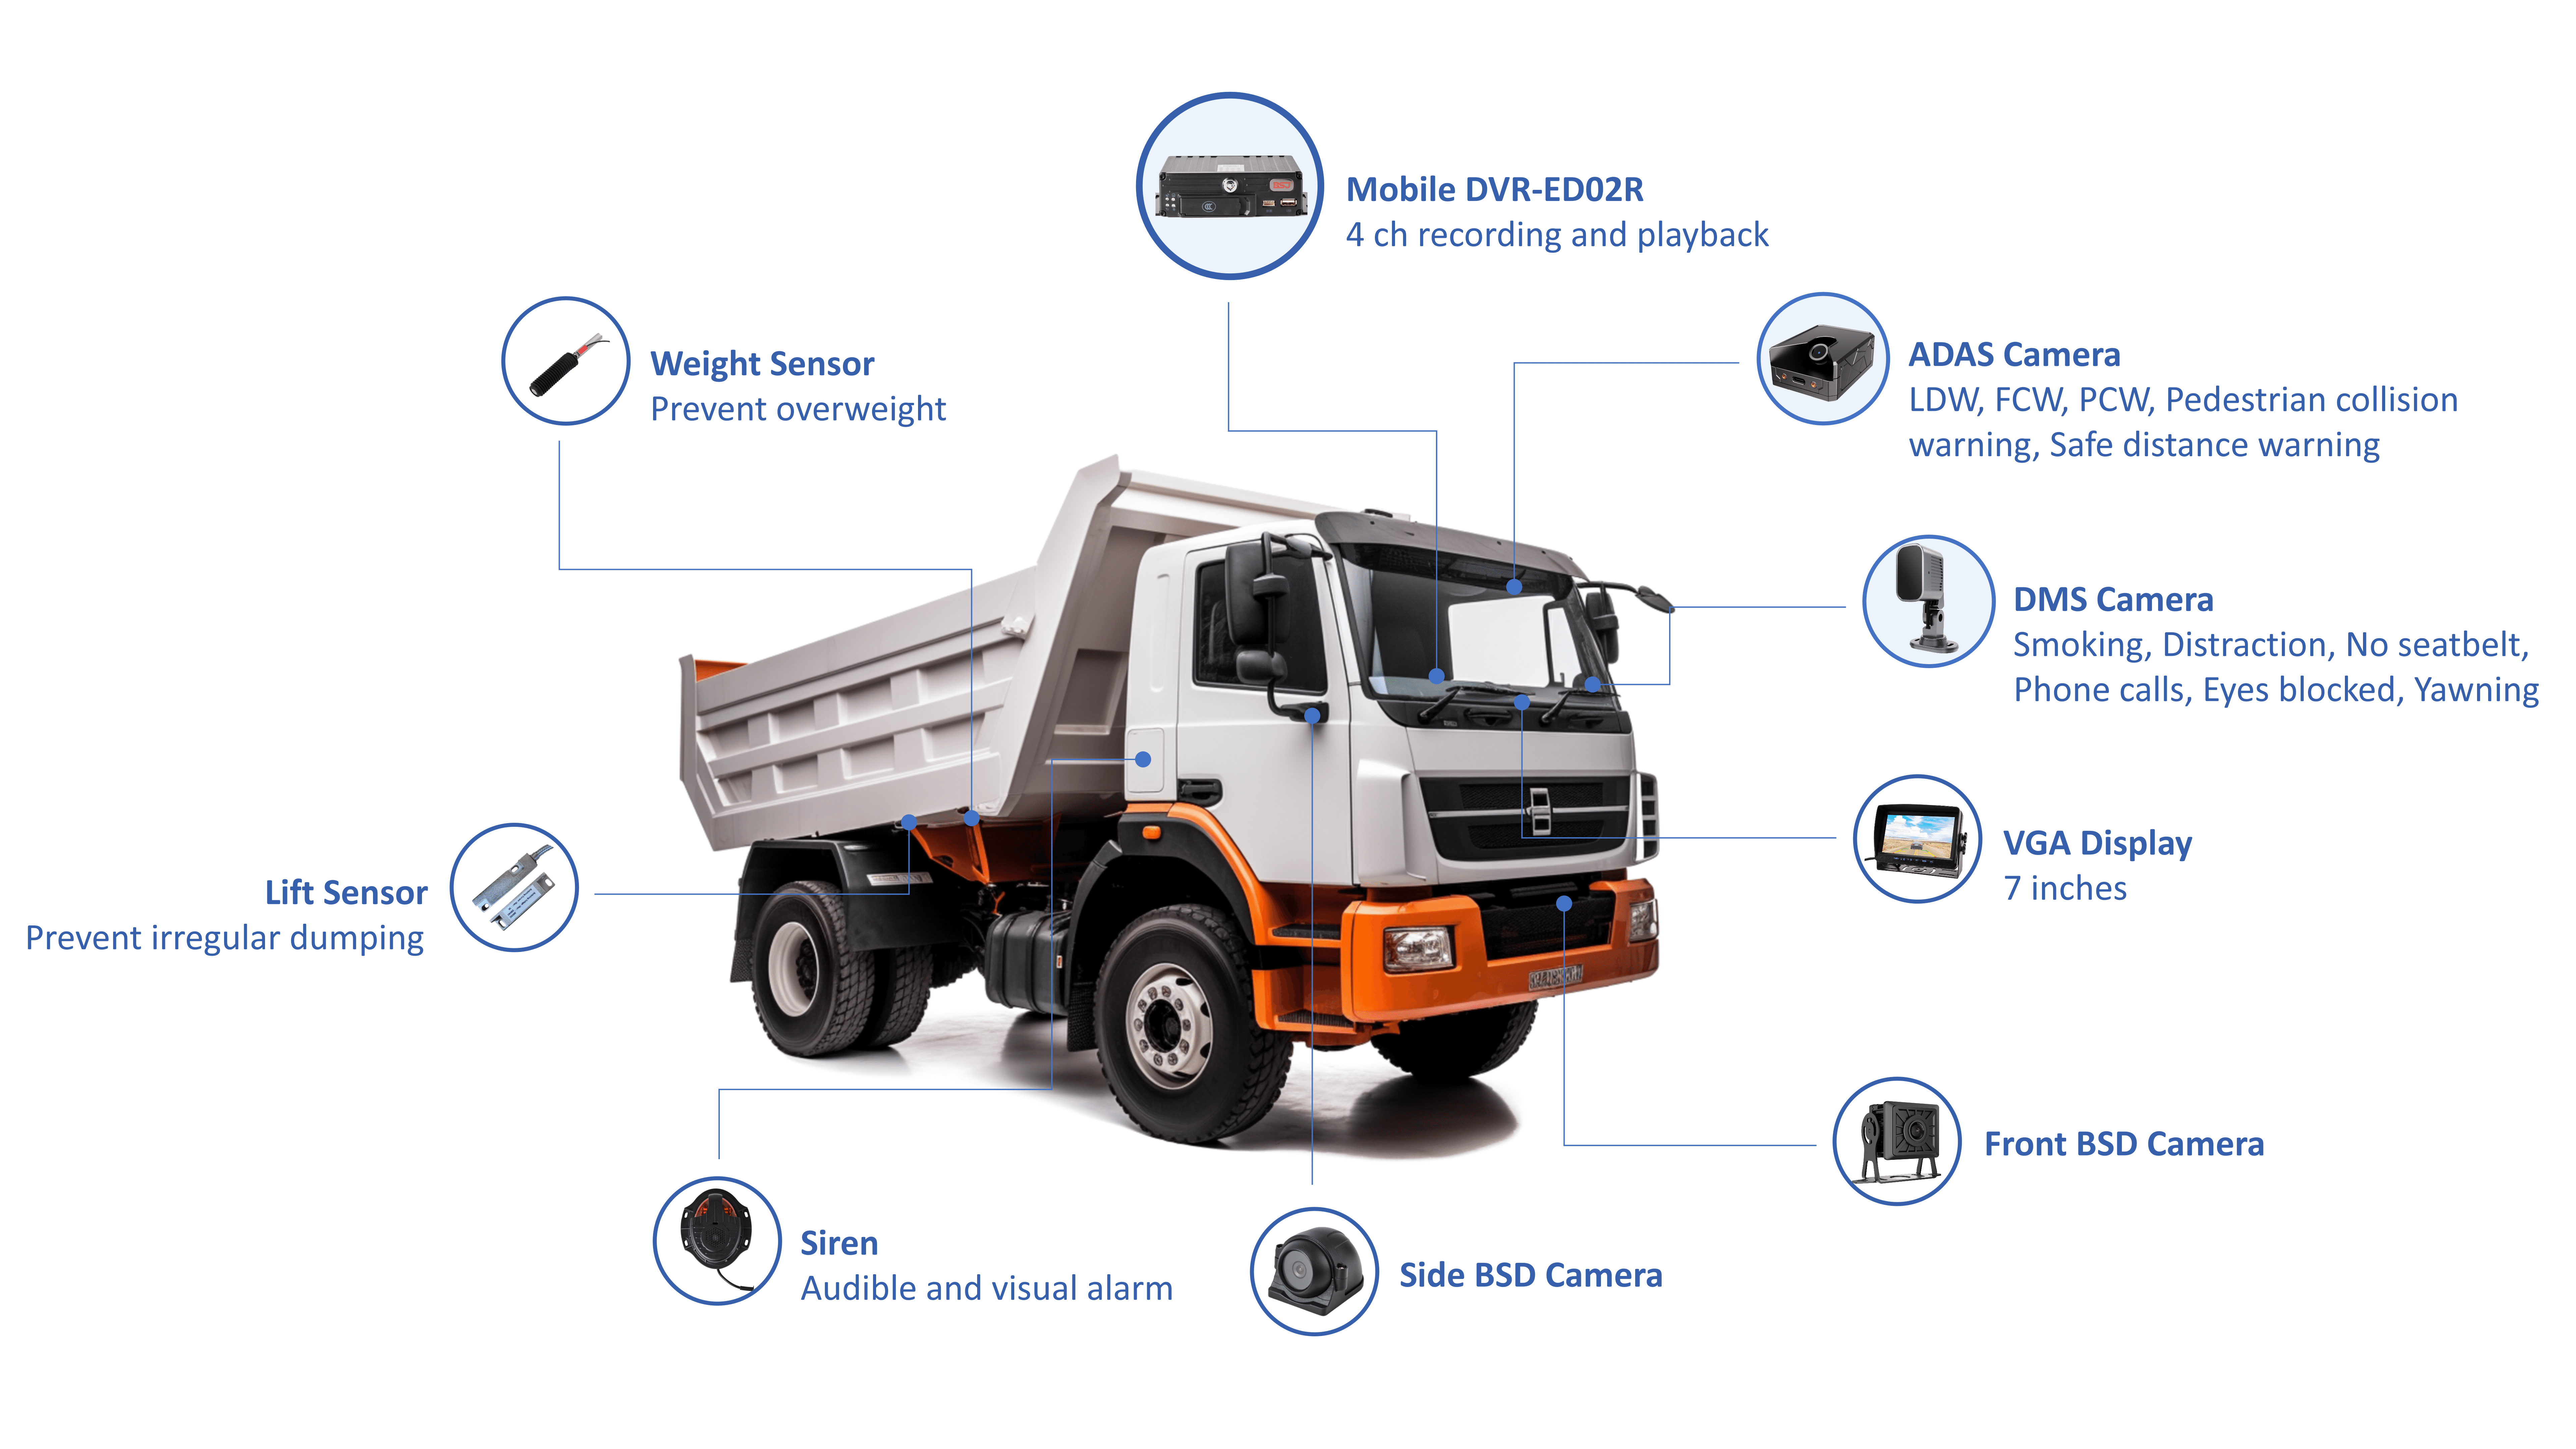
Pick metrics that tie to cash and service. Track these consistently:- Fuel spend per mile (or per hour for urban stop-and-go routes).- Maintenance cost per vehicle and mean time between failures.- Utilization: active hours per vehicle versus paid hours.- Driver labor cost per completed trip or per hour.- On-time delivery rate and customer delay costs.- Idle minutes per vehicle (convert to fuel/labor waste).- Compliance fines avoided and insurance claim frequency.Basic ROI math that actually helps: estimate annual savings from each metric, add them to get total annual benefit, then compute payback months = initial investment / annual benefit. Example: if a 100-truck upgrade costs $120,000 and yields $48,000/year in combined fuel, maintenance and labor savings, payback = 120,000 / 48,000 = 2.5 years. Keep it simple and show your CFO the inputs.
How to run a problem-driven evaluation that convinces skeptics
Start by proving the problem exists with raw baseline data for 30–90 days. Then pilot a small, representative slice of your fleet and measure the same KPIs. Steps that work:- Baseline: gather invoices, telematics raw feeds, repair logs, and duty rosters.- Pilot design: pick routes that stress the issues you’re solving (high idling, heavy maintenance).- Measurement window: 60–90 days is usually enough to see fuel and maintenance shifts; include a pre/post comparison.- Attribution: control for seasonal or route changes — compare like-for-like.- Scale decision: multiply per-vehicle gains across the fleet and recalc payback.Don’t rely on vendor dashboards alone. Pull raw exports and cross-check with your fuel cards and repair bills. That’s how you turn a pilot into a defensible case.
Common pitfalls and how to avoid them
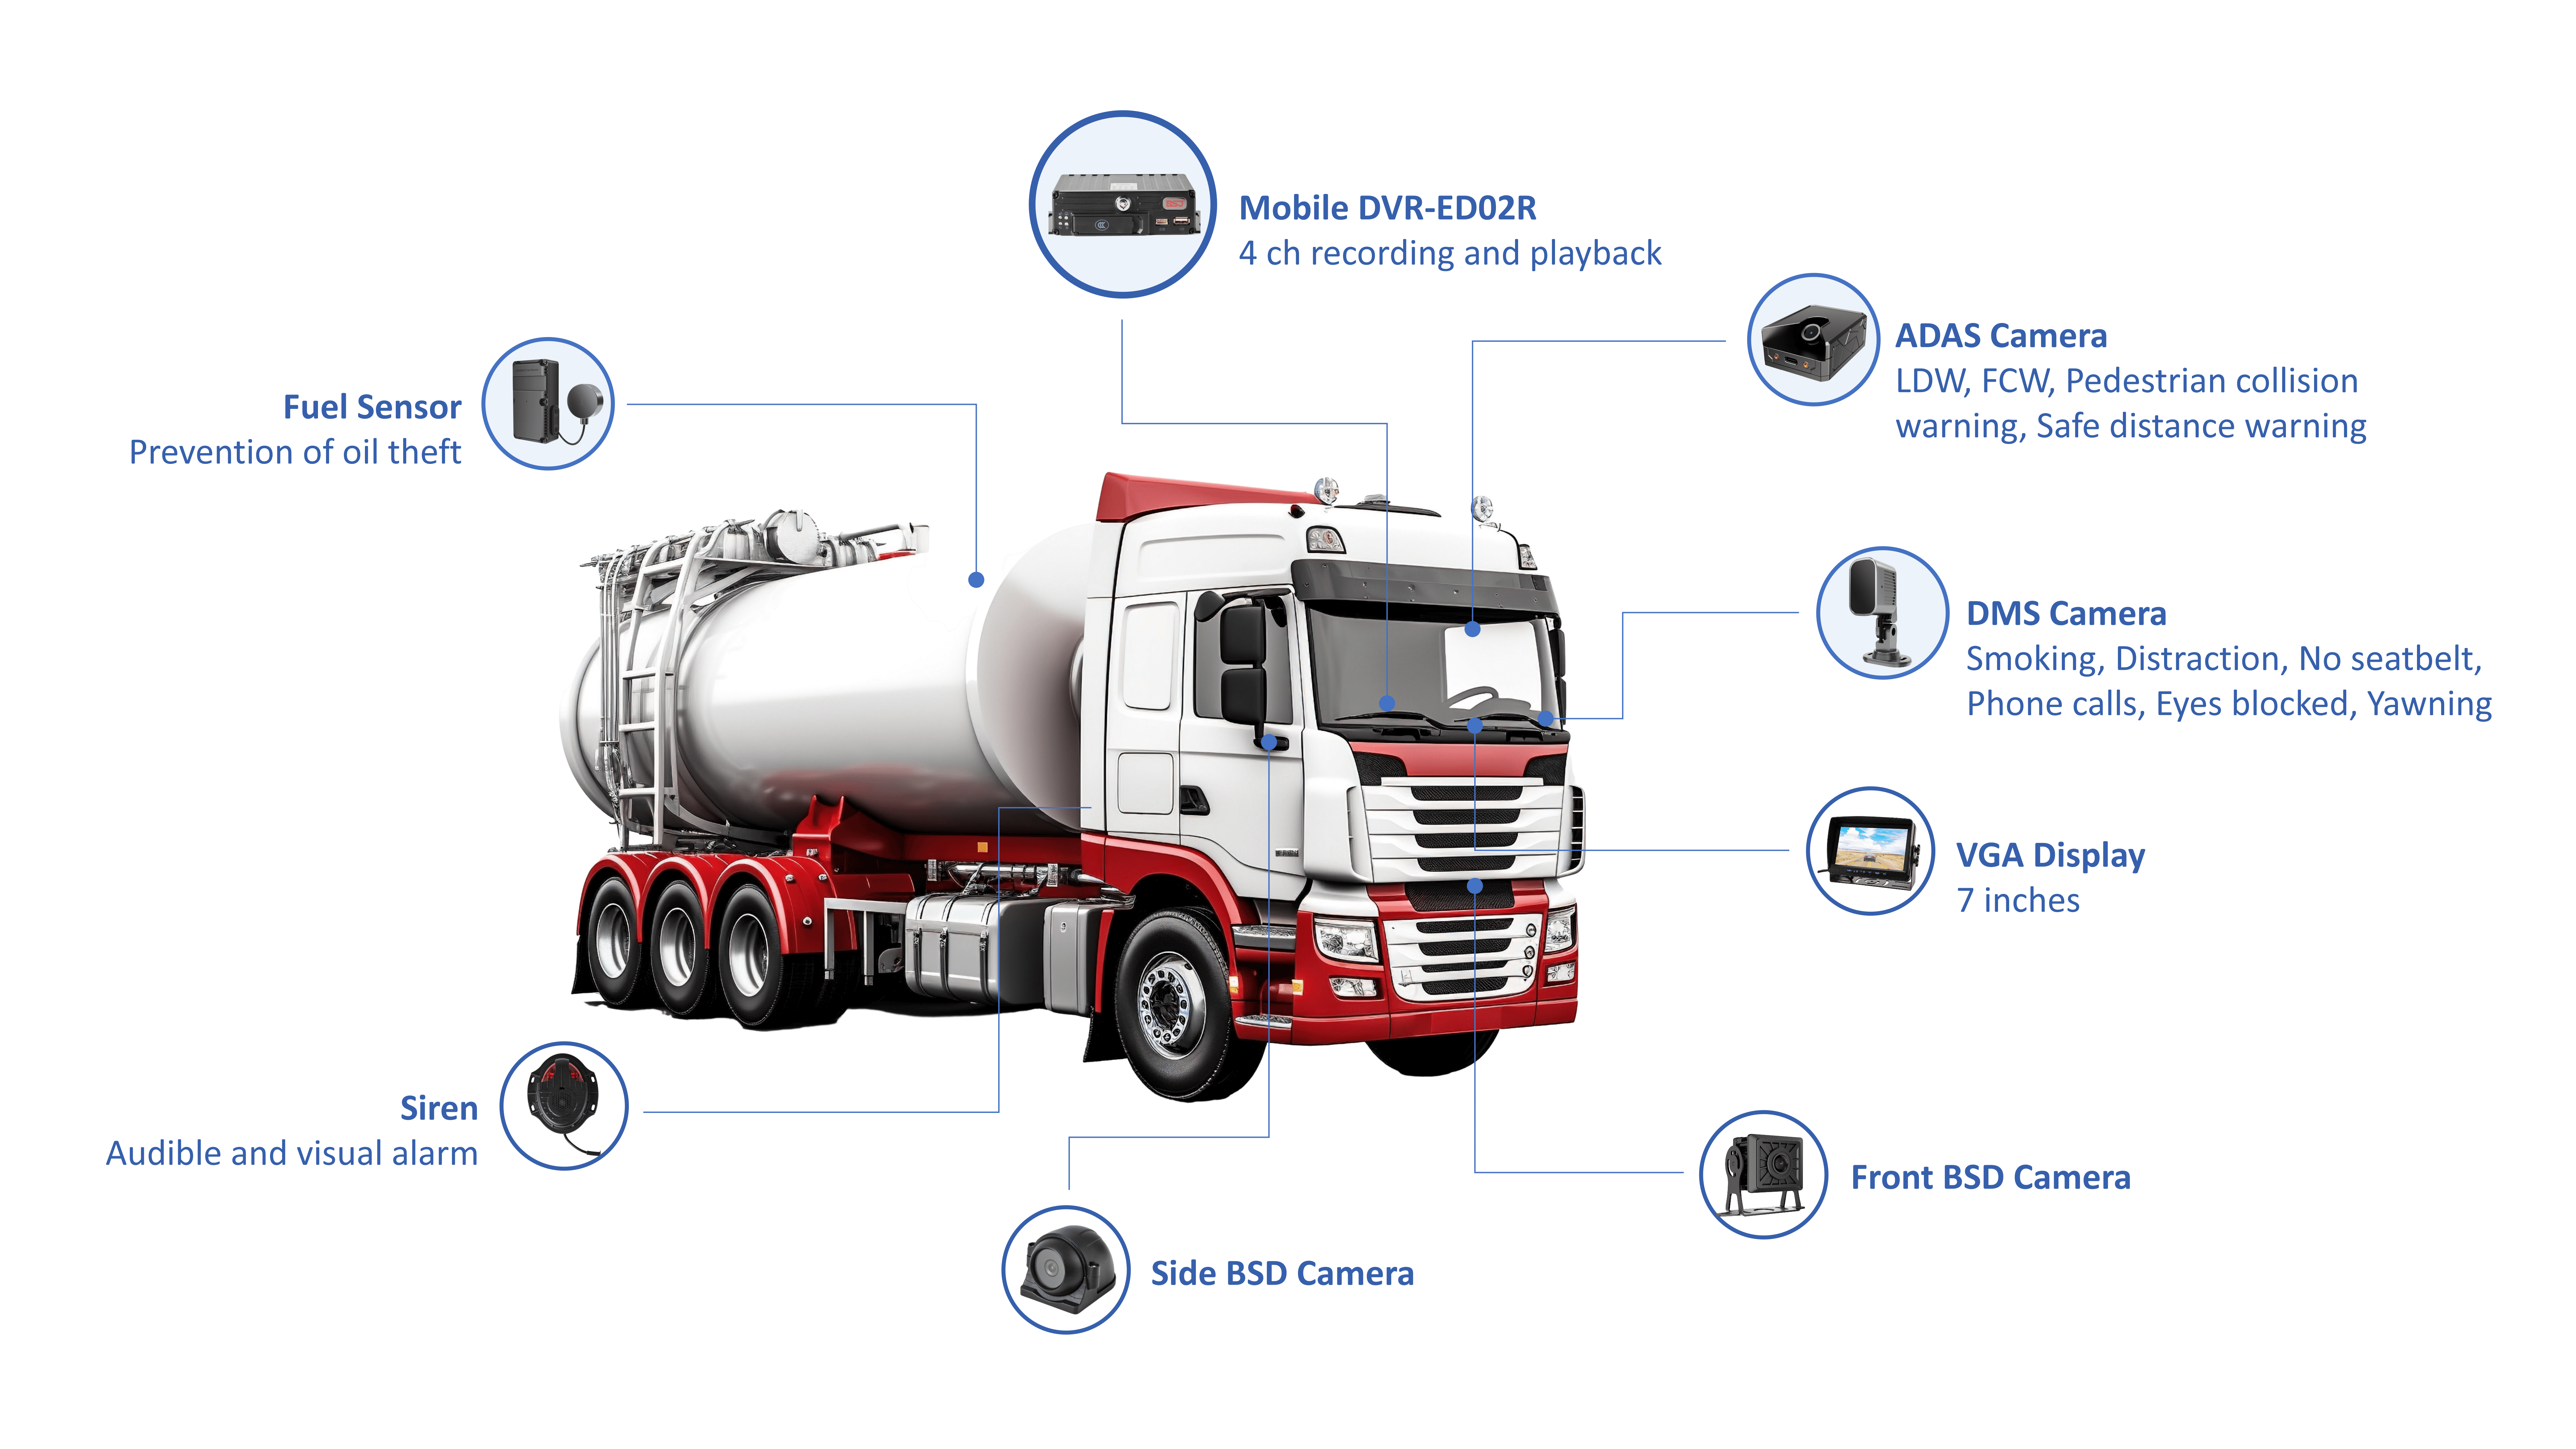
Watch for these traps:- Assuming vendor claims apply across your unique routes — they often don’t.- Ignoring integration cost: telematics, ERP, payroll links add effort and hidden fees.- Counting “improved visibility” as a dollar saving without linking to an action (e.g., route change or idle reduction).- Skipping driver buy-in — new systems fail when drivers see them as extra work.Fixes are straightforward: require exportable raw data, budget for integrations, define action triggers that convert visibility into behavior change, and run short driver-focused training during the pilot.
Decision checklist — yes/no rules for signing a deal
Before you sign, answer these:- Can we export raw positional and event data? (If no, walk away.)- Will the system reduce a real line-item cost when we act on the data?- Is the vendor willing to run a scoped pilot with penalties or success criteria?- Do we have integration plans for fuel cards, maintenance, and payroll?- Is there a clear break-even timeline under conservative assumptions?If most answers are yes, you’ve moved from marketing to measurable buying.
Small formulas you can use today
Keep these in your deck:- Payback months = Investment / Annual net savings.- Annual net savings = Fuel savings + Maintenance savings + Labor savings + Avoided fines/claims.- Per-vehicle annual benefit = (Savings per month × 12).Run conservative estimates (50–70% of vendor promises) and test whether payback still meets your threshold.
Wrap-up — what actually matters
Measure real pain, run a focused pilot, validate with raw data, and force financial math that ties to invoices and payroll. That’s how you move from dashboards to dollars. If you want a sensible example of a supplier that aligns technical capability with operational proof points, look for partners who can speak to on-the-ground pilots and integrations, the kind of practical collaboration I’ve seen work repeatedly with BSJ.